Back in VMWorld 2019, VMware made an exciting announcement — Project Pacific — to bring the best of the proven enterprise virtualization platform vSphere and the defacto Container Orchestration engine Kubernetes into an integrated Modern Application Platform. The new platform, vSphere7 or commonly refers as vSphere with Kubernetes, is generally available since April 2020.
To keep up the real sense of Kubernetes is a “Platform Platform,” vSphere 7 with Kubernetes gives a Platform for its users to run multi form-factor modern workloads, say…Kubernetes Clusters (Tanzu Kubernetes Cluster Service), Container Workloads as Native vSphere Pods, and VMs.
The Kubernetes APIs gives additional flexibility for the vSphere Admins to define Name Space as a Unit of Management and provision it to the platform users to consume the resources via the Kubernetes declarative model.
Since the new Construct called vSphere Pod, which gives the flexibility to run Kubernetes Native Workload (Container Pods) directly on Esxi, is a new kid in the block, it may be a good idea to explore its unique use cases.
In this Multi-Part Series, I am trying to declutter the Compute resource characteristics of vSphere Pods in vSphere with Kubernetes platform. Understanding the Compute resource patterns in vSphere Pods is one of the essential criteria to choose the right workloads to deploy as vSphere Pods.
To analyze the characteristics of the Native vSphere Pod object of the vSphere with Kubernetes platform, I am impersonating a DevOps engineer than a vSphere Admin. As a DevOps persona, I walk through the resource model of the vSphere Pods to do some fact checks and recommend it as the best platform for specific containerized workloads.
What is a vSphere Pod?
The all-new Object in vSphere with Kubernetes, which enables the users to run Containers natively on ESXi hosts, is called vSphere Native Pod, a.k.a vSphere Pod.
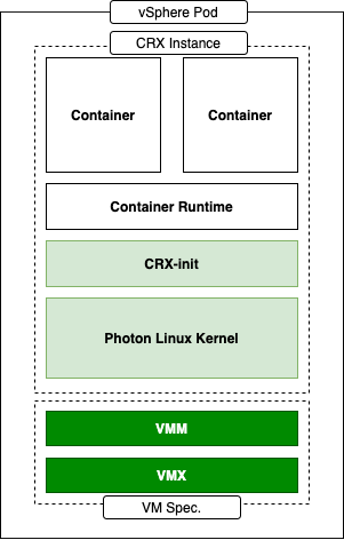
In a nutshell, vSphere Pod is a virtual machine that is highly optimized to boot a Linux kernel — Container Runtime Executive (CRX) to run containers. The CRX agent includes only just enough para-virtualized devices like vSCSI and VMXNET3. During the Pod initialization, the super-thin `kernel` (CRX) does a fast and secure boot process. After the CRX initialization. the containers, part of the Pod, will run in quick succession
Fig:1 vSphere Pod

Considering the objective of the article, doing a quick cut to dissect the compute resource characteristic of the vSphere Pod. You may follow the referral URLs for a deep dive into vSphere Pod internals.
What is the default resource allocation of a vSphere Pod?
Let’s take the Kubernetes native way to check the compute resources `visible` from the Containers is using the Kubernetes downwardAPIs.
I created a tiny (also a bit crude!!!) `PHP web app,` which could display its compute resource Request and Limits from the downward API.
Requests are what the Container is guaranteed while scheduling it to a node. Limit limits the Container from goes above a configurable value of the resources.
Since the Test Pod is a single Container Pod, the resource values are quite easy to correlate as the Pod resource.
CPU and Memory resource `request` and `limit` parameters of the Container can get via the following downward API `resourceField Ref.’
. requests.cpu
. requests.memory
. limits.cpu
. limits.memory
The data from the downwardAPIs can consume as an environment variable or as downward API volume inside the Pod.
Scenario 1:
In the first scenario, the test app deploys as a vSphere Pod and has no custom resource request or limit configured. It means the Container can use the default resources allocated to the vSphere Pod.
Since each of the vSphere Pod has its own `kernel,` to schedule the resources between its processes, the Pod’s resource limit is the limit of the resources the Containers of the Pod can consume.
The following command will deploy the test application in a namespace, `vsphere-pod-resource-test`: ( What a meaningful name!!!)
kubectl create -f https://raw.githubusercontent.com/emailtovinod/vsphere-pod-resource/master/resource-test-app-deploy.yaml -n vsphere-pod-resource-test
To access the Application externally using the browser, use the following command to create a service of type `loadbalancer`:
kubectl create -f https://raw.githubusercontent.com/emailtovinod/vsphere-pod-resource/master/resource-test-app-svc.yaml -n vsphere-pod-resource-test
Find the IP of the loadbalancer service :
kubectl get svc -n vsphere-pod-resource-test
The test Application has the necessary instrumentation to display the resources allocated to the Pod via the URL:
http://<loadbalancer ip>/resource.php
Fig:2 vSphere Pod Resources

As you can see here, since there is no `resource request,` the value of CPU and Memory values are showing as Zero.
vSphere Pod default value of CPU is `1000 millicores` ( 1 Core) or in plain, 1CPU Core, and the memory limit is 512 MB. If there is no custom/default resource specification for the Containers, it is the limit of the resources the containerized processes run as the vSphere Pod could consume.
Scenario 2:
Let us do a second scenario to check the default resource allocation of a Pod deployed in a Kubernetes Conformant cluster.
Create an application deployment using the same manifest in a Tanzu Kubernetes Cluster (TKC) service or any other conformant Kubernetes Cluster. It provides us a clear distinction between the resource patterns of vSphere Pods and Pods running on a conformant cluster.
Follow the steps to deploy a test Application Pod in a Kubernetes Conformant cluster.
Create a Namespace to deploy the Application:
kubectl create namespace pod-resource-test
The following command deploys the test Application:
kubectl create -f https://raw.githubusercontent.com/emailtovinod/vsphere-pod-resource/master/resource-test-app-svc.yaml
Access the test application WebUI via the loadbalancer IP:
http://<loadbalancer ip>/resource.php
The following diagram shows the default resource of the Pod showing via the downward APIs of Tanzu Kubernetes Cluster.
Fig:3 Default Pod Resources

As discussed earlier, there is no resource request for the Container, hence the value `0` for both CPU and Memory request.
But the CPU and Memory limit of the Pod in the conformant cluster is showing significantly higher value. If you carefully observe the limit values of CPU and Memory, you could find that these values are nothing but the total resources available in the Node on which the Pod is running.
What does that mean? Can the Pod use all the Node resources? The Obvious answer is `It depends.`
To further declutter the `depends` clause, we need to go a little bit deeper.
The Resource Quality of Service (QoS)
Kubernetes’ resource allocation model classifies the resource Quality of Service (QoS) of the Pods deployed without any resources specification as `Best Effort.` `Best Effort` is the lowest priority resource QoS.
[Ref.https://kubernetes.io/docs/tasks/configure-pod-container/quality-service-pod/]
The other two levels of resource QoS are `Burstable` and `Best Effort.`
The second most resource allocation priority goes to Burstable QoS, where the Containers have requests and optional limits (not equal to 0) specification.
The highest resource priority — Guaranteed QoS` assigns to Container Pods deployed with limit and optional requests (not equal to 0) values.
At a high level, the Completely Fair Scheduler (CFS ) C-Group bandwidth controller of the Linux kernel enforces the CPU `limit ` of the Containers. If the Node doesn’t have enough CPU resources to share with the Pods scheduled in it, Pods with `best effort QoS Class` are the ones suffer first from CPU throttling or even Pod eviction from the Node.
If there is not enough memory to allocate to all the Pods scheduled in a node, the Applications running as `Best Effort Class` Pods get terminated by OOM (Out of Memory) killer.
Linux CGroup and Application Behaviour
Linux Application containers rely on the Linux Kernel CGroup subsystem to manage the compute resources. The CGroup provides a unified interface for the Containers to limit, audit, and control the resources. It means the CGroup subsystem in Linux configures the resource allocation of the processes as per the Pod template specifications.
Applications and CGroup Awareness
In the third scenario, update the vSphere Pod deployment with a custom resource parameter.
Scenario 3:
The following command will set a custom resource limit of 1 CPU and 1 GiB of Memory for the vSphere Pod:
Note: If you are specifying only limit and no request values for the Containers, the limit assigns as request value too.
kubectl set resources deployment rm-demo-app limits=cpu=1,memory=1Gi -n vsphere-pod-resource-test
You may verify the values from the WebUI of the Application, which is displaying using the downwardAPIs.
Fig:4 vSphere Pod Resources with the Limit spec.

Here we use Native Linux Tools to check the Compute Resources of the Pod to explore some interesting facts.
As you see in the earlier steps, hence the test Application Pod has only one Container, its resource Specification is equal to that of the Pod.
Use `nproc` and `free` commands to check the memory and CPU resources of the Container of the vSphere Pod:
You may see the following Output, showing the CPU and Memory resources of the vSphere Pod.
Fig 5: nproc command output from the vSphere Pod

Fig 6: free command output from the vSphere Pod

You may note that the output of the Linux Native tools and the Application displayed via Kubernetes downwardAPI are the same as the values, we set as the Container Resource Limits. Since the test application Pod has only one Container, it is equal to the resource availability of the Containerized process.
As the last scenario in the series go ahead and set the resource limit for Pod deployed in the conformant Kubernetes Cluster.
Scenario 4:
To check the resource behavior of the Pods running in the Conformant cluster, set a resource limit of 1 CPU and 1 GiB of Memory using the following command:
kubectl set resources deployment rm-demo-app limits=cpu=1,memory=1Gi -n pod-resource-test
The command will update the Pod template and a new Pod will create. After a few seconds, the new resource values will appear in the test Application WebUI.
Fig 7: Pod Resources with the Limit spec.

As did with vSphere Pod, use native Linux tools `nproc` and `free` to check the CPU and Memory showing inside the Container
Fig 8: nproc command output from the Pod

Fig 9: free command output from the vSphere Pod

Although we set the same resource parameters for the Container of the vSphere Pod and the Container of the Pod running in the Conformant cluster, nproc and free Commands showing 2CPU and 3947 MiB of Memory, respectively for the later. Why are the Native Linux tools showing a vast difference between its output from vSphere Pod and the Pod in the Tanzu Kubernetes Cluster? Here comes the `CGroup Awareness` factor of the tools and applications running within a Linux Application Container.
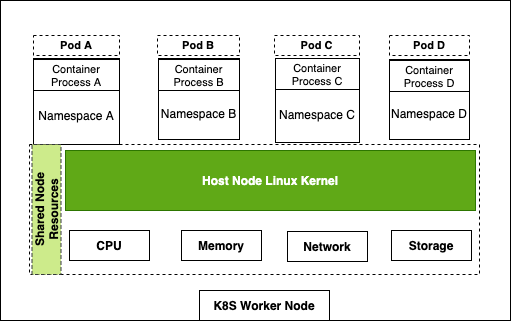
As you already know, Containers resource parameters configured via the Cgroup subsystem. Both `free ` and `nproc` using `Procfs` to find the information, not the Cgroup subsystem. For those who new to Linux, Procfs or “/proc” is a particular filesystem under Linux that presents process information and kernel parameters.
Fig 10: K8S Node Resource Share Model

In simple term, the tools which are not Cgroup_Aware( Since those tools came into existence much before Cgroup) give a skip to the Cgroup settings and show the total compute resources of the Node on which it currently scheduled.
Is that the ` legacy tools` problem alone?
Not really. Consider a typical example of Java Virtual Machines (JVM)- Version 8 and below. While the JVM is running as Container or otherwise, JVM ergonomics sets the default values for the garbage collector, heap size, and runtime compiler. These values are consuming from Linux `sysfs` of the Node, not from the CGroup subsystem of Linux.
Sysfs is a bit modern and structured than procfs in which “sysfs” mounted on /sys as a way of exporting information from the kernel to various applications.
As a workaround, you can provide custom JVM settings as per the Container resource using Kubernetes API objects like Config Map and downWard APIs. ( Demonstration of it is not in the scope of this article). But the fact of the matter is, these additional requirements adds overhead in the deployment process. To avoid complexity, most of the production environments do not bother to adopt that pattern.
But the caveat here is, even though JVM configures its default values as per the resource information fetch from sysfs, the Linux Kernel resource scheduler will enforce the compute resource parameters allocated to the Container using CGroup subsystem. It commonly leads to frequent `OOM` errors in the application execution environment. Even worse, the cluster Operators end up in Over allocation of resources to the Container to mitigate the OOM errors.
How vSphere Pod helps here?
As we observed, since there is a dedicated Linux Kernel to manage, each of the vSphere Pods’ resource scheduling, the compute resource values reported via Linux sysfs and Procfs are the same as that of the total Compute resources configure using Linux CGroup. ( In case of multi-container pods, the sum of the resources specification of all its Containers provides the Pod’s resource).
It is a huge advantage for the SREs /DevOps engineers planning to run the non- CGroup aware application as Containers and manages them using Kubernetes APIs. Whenever a Critical workload has precious resource requirements, vSphere Pod is an ideal destination without the concerns of the CGroup based resource control model. It is apart from the other unique resource allocation characteristics of vSphere Pods like NUMA node placement etc. Probably a subject for another article.
Conclusion
The article’s objective is to demonstrate one of the resource patterns of the vSphere Pod and how it makes it an idle solution for some of the Workloads.
Now, you may ask, Well, Is it an `Anti-Pattern` of sort for some other workloads? You guessed it, right !!!
If you look at the default minimum resource allocation of the vSphere Pod, it is 1 CPU and 512 MB of Memory. ( Not considering the storage aspect here). At least in the current version of the platform, though you can configure the default CPU and Memory values for the container, the vSphere Pod level resources cannot set less than the default ones.
vSphere Pods only supports increasing the values higher than the default one using the resource request and limits. You may notice that the defaults compute resources of the vSphere Pods turn out to be over-provisioning for most of the Cloud Native stateless workloads and could easily overshoot the `resource budget` of the cluster.
Here comes the flexibility of `vSphere with Kubernetes` platform. To run more optimized Cloud Native workloads and the Developer Environments, you can deploy Tanzu Kubernetes Cluster (TKC) Services — a conformant Kubernetes cluster — in a Supervisor cluster Namespace and use it side by side with the vSphere Pods.
References:
https://frankdenneman.nl/2020/03/06/initial-placement-of-a-vsphere-native-pod/
[Ref.https://kubernetes.io/docs/tasks/inject-data-application/downward-api-volume-expose-pod-information/]
https://www.kernel.org/doc/Documentation/cgroup-v1/cgroups.txt
https://kubernetes.io/docs/concepts/configuration/manage-resources-containers/
